The Classic Guide to Charting and Market Psychology — Still Worth Reading Today?
🎯 Introduction: A Bible for Chart-Watching Investors
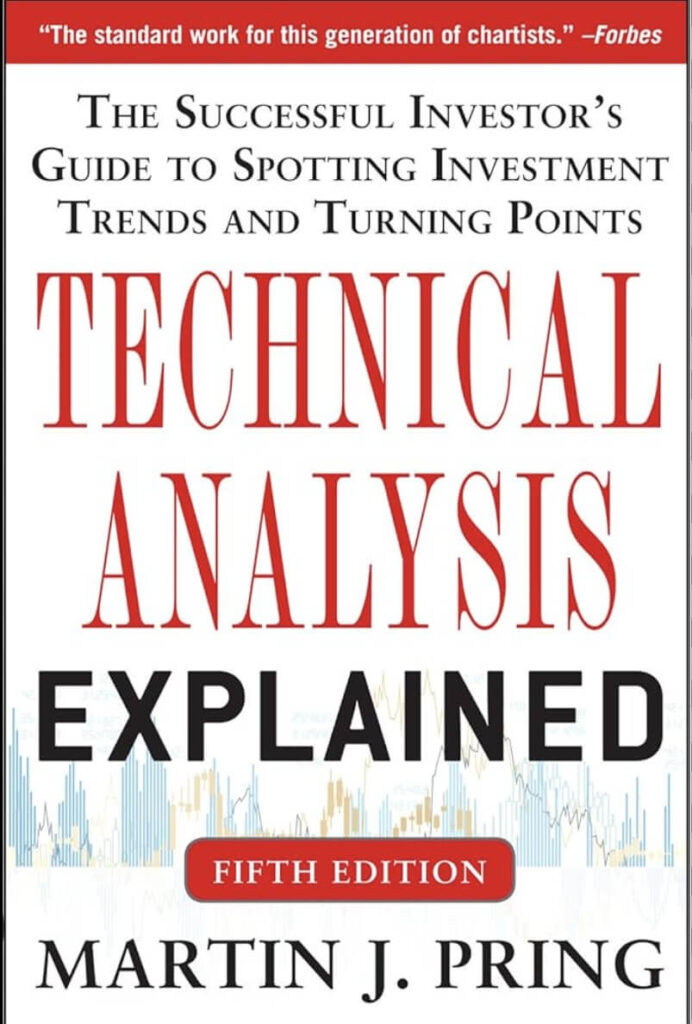
Martin Pring’s Technical Analysis Explained isn’t just a book — it’s a rite of passage for anyone who’s ever looked at a stock chart and wondered, “What does this pattern mean?” First published decades ago and revised multiple times, Pring’s work has become a cornerstone of technical analysis literature.
Dubbed by some as the “Bible of technical analysis,” this 600+ page tome offers far more than just chart patterns. It’s an attempt to formalize market psychology and price behavior into a framework you can act on.
But is it still relevant for the modern DIY investor with access to instant data, AI-driven tools, and zero-commission trades? And is it too dense for someone without a formal financial background?
Let’s break it down.
🧠 Core Philosophy: Markets Move on Emotion
At the heart of Pring’s approach is the idea that prices reflect crowd psychology — not just earnings reports or economic forecasts. Charts, then, are visual footprints of emotion: greed, fear, complacency, and euphoria.
Pring’s main message: You don’t need to predict the future. You need to understand behavior. If you can spot when the crowd is too bullish or too bearish, you can position yourself accordingly.
He doesn’t claim technical analysis is infallible — in fact, he acknowledges its flaws. But he insists it gives you an edge, and for DIY investors, that edge can be the difference between profit and pain.
💼 What’s Inside: A Structured, Serious Toolkit
Pring organizes the book in a logical, hierarchical way, starting with basic charting concepts and gradually moving toward more advanced indicators and strategies. Here’s a quick breakdown:
⦁ Chapters 1–6 cover the foundational tools: trendlines, support/resistance, volume, and chart types.
⦁ Chapters 7–14 dig into patterns: head and shoulders, double tops, triangles, etc.
⦁ Chapters 15–25 shift toward indicators: moving averages, RSI, MACD, and more.
⦁ Later chapters discuss system development, market cycles, intermarket analysis, and behavioral finance.
Unlike some books that throw buzzwords at you, Pring patiently builds up the logic of each method, often layering in historical examples and psychological insight. It’s not a light read — but it is comprehensive.
🗺️ What Readers Love (Based on Positive Reviews)
✅ 1. Unmatched Depth and Structure
This isn’t a clickbait guide promising riches overnight. It’s an encyclopedic manual with academic rigor. For self-taught investors, it fills in the “why” behind many popular trading tools.
✅ 2. Emphasis on Psychology and Market Sentiment
Pring goes beyond the usual pattern-spotting. He explains why patterns work — rooted in behavioral finance and crowd dynamics. This gives readers a more nuanced understanding than most YouTube tutorials or blog posts.
✅ 3. Rich with Examples and Historical Context
The book draws on charts from multiple decades, showing that technical patterns persist across market environments. It’s not about memorizing shapes — it’s about learning how markets breathe.
❌ Where It Falls Short (Based on Critical Reviews)
❌ 1. Overwhelming for Beginners
At over 600 pages, this is not a book you power through in a weekend. The writing, while clear, is academic. Readers who are new to investing — let alone technical analysis — may struggle without a simpler primer first.
❌ 2. Limited Practical Application Guidance
While Pring explains a wealth of concepts, he stops short of walking you through live trades. There’s little “do this, not that” instruction. For hands-on learners, this can feel abstract.
❌ 3. Shows Its Age in Places
Although updated editions include newer examples, the overall tone and layout reflect an earlier era of finance — before algorithmic trading, mobile apps, and meme stocks. Some methods may feel dated in today’s ultra-fast markets.
🔍 Deeper Analysis: Is It Useful for the DIY Investor?
For DIY investors willing to study — really study — this book can be transformative. It teaches not just tools, but a way of thinking about markets. It encourages disciplined observation over impulsive trading.
However, it’s important to note:
⦁ This is not a trading strategy book. It won’t give you a plug-and-play system.
⦁ It assumes patience and commitment. If you’re looking for fast results, this isn’t the right fit.
⦁ You must pair it with hands-on experience. Reading about indicators is one thing; applying them in a trading platform is another.
Still, for investors who want to avoid the hype and develop long-term technical skills, this is one of the best guides available.
📖 Comparison: Better Than Modern Alternatives?
Compared to lighter, modern books like How to Make Money in Stocks by William O’Neil or Japanese Candlestick Charting Techniques by Steve Nison, Pring’s guide is less trendy — but far more robust.
Think of it this way:
⦁ O’Neil’s work = quick-start strategy book
⦁ Nison’s book = visual, pattern-centric guide
⦁ Pring’s work = complete university course in technical analysis
The question isn’t whether it’s better. It’s whether you’re ready for it.
✅ Pros and ❌ Cons for the DIY Investor
✅ PROS:
⦁ Highly Comprehensive – Covers nearly every aspect of charting and technical tools
⦁ Teaches the “Why,” Not Just the “What” – Ideal for building real confidence
⦁ Rooted in Behavioral Finance – Helps you understand market participants, not just price
❌ CONS:
⦁ Not Beginner-Friendly – May be overwhelming without prior exposure to investing
⦁ Dense and Theoretical in Parts – Lacks hand-holding or step-by-step action plans
⦁ Occasionally Dated – Doesn’t fully integrate new technologies or trading platforms
⭐ Final Verdict: ★★★★☆ (4.5/5)
Technical Analysis Explained is a heavyweight champion of trading literature — but it’s not for everyone. If you’re a serious DIY investor ready to go beyond tips and tweets, Pring delivers the substance you need.
That said, the book demands your time and attention. It’s not a quick read or a casual dip. But if you commit to it, you’re likely to emerge with not only a better understanding of the markets but also a sharper ability to think like a disciplined trader.
Who Should Read It:
⦁ Intermediate investors ready to level up their technical skills
⦁ Anyone curious about market psychology and charting
⦁ Self-directed traders tired of noise and looking for structure
Who Might Want to Skip It:
⦁ Total beginners with no charting experience
⦁ Traders looking for a quick-and-easy strategy
⦁ Investors who prefer passive, fundamentals-based approaches
📌 “Read it to master the craft — not just to follow the crowd. This is not the on-ramp. It’s the full road map.”